I’ve done an analysis of 10/09/2017
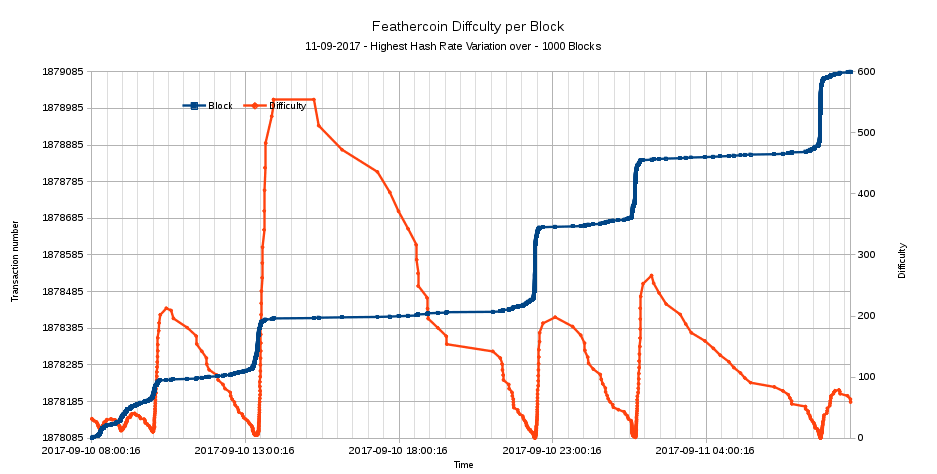
It can be seen that a very large hash rate was directed at FTC at 9am, 12:30pm, 22:30 and 8 am 11/09/2017.
| Block |
Time |
Trans |
Value |
Difficulty |
CDD |
Block Time |
Tran |
Temporal Anomaly |
| 1879055 |
2017-09-11 07:46:25 |
4 |
1878422.28 |
13.272 |
137.97 |
00:01 |
1 |
| 1879054 |
2017-09-11 07:46:24 |
3 |
2502104.72 |
12.166 |
136.55 |
00:09 |
1 |
| 1879053 |
2017-09-11 07:46:15 |
3 |
1514184.12 |
11.152 |
97739.62 |
00:09 |
1 |
1 |
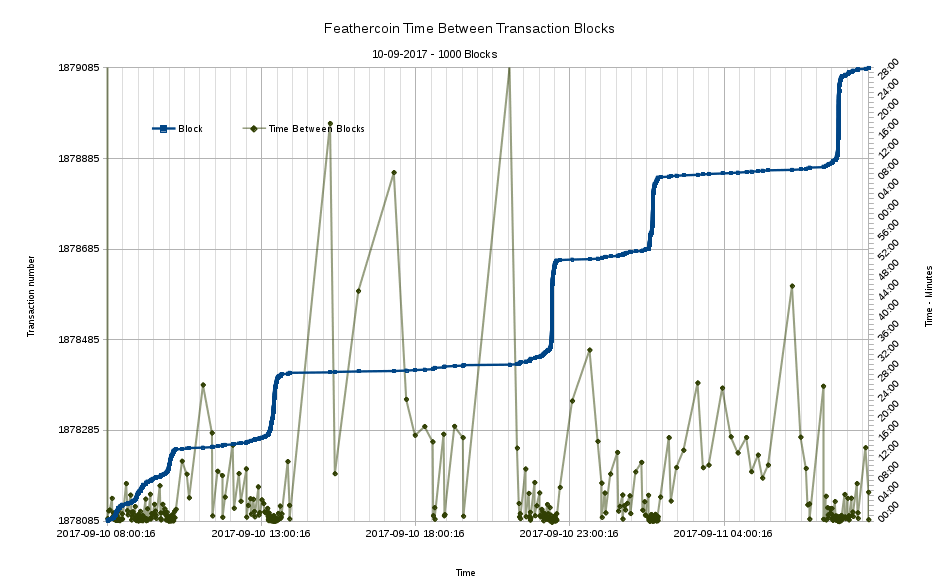
Transactions 1878844 and 1878869 were not done during high hash rate, so had long transaction block confirmation times. The temporal anomaly is due the time of these blocks being slightly before the previous block, however its within a “normal margin”, especially with such a large over hash rate of ~50 times.
Overview and Conclusions
The Feathercoin difficulty has increased to an average value of 36, with peak values near 500. The hash variations is much larger than previous analysis, showing very high levels of hash power being directed at FTC. Almost too high possibly indicating a very large pool or some new equipment available to one miner.
This analysis is a check of blockchain timings and activity. Over 1000 Blocks … from 9th to 10/07/2017
The average block time over 1000 Blocks is bad at 1:33 mins
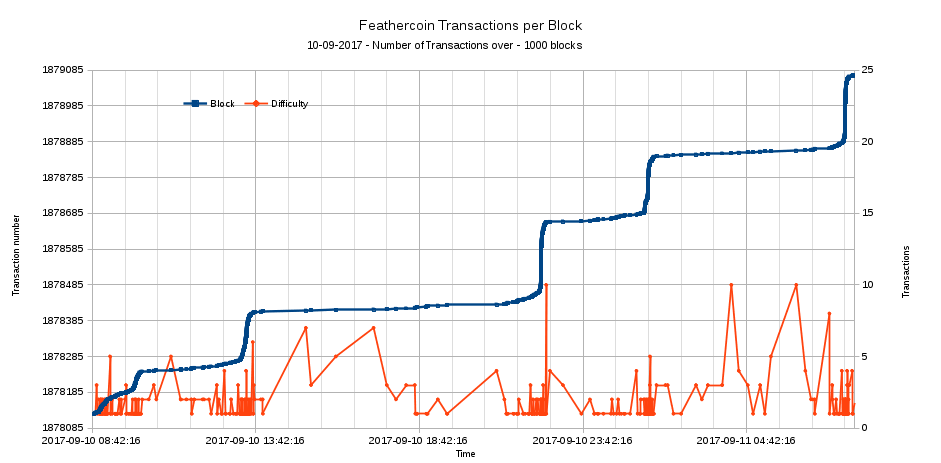
The percentage of blocks with transactions was ~14% of blocks. The transfer to Fee value is also “normal” at 1% Value transfered
There were 167 minor time anomalies in the blockchain timings for the 1000 min test period. Many of those time anomalies were due to Blocks with the similar times, before.
Feathercoin Block Analysis
FTC is routinely analysed if there are any concerns. These analysis are stored on Github to use as templates or review historical analysis.
Values of the parameters analysed can be extracted from FTC debug file. The ABE software used to produce sites such as http://explorer.feathercoin.com/chain/Feathercoin?count=1000&hi=1783533 does some of this work for you, so for sporadic analysis of a few days it is convenient to scrape the data from there.
Normally the web site displays up to 100 blocks but this can be expanded manually.
The data is accumulated in a text document, then pasted into the spreadsheet template from the last analysis. Charts and calculations data ranges are corrected as required.
Overview of the 1000 min period up to 11/09/2017
FTC Fees over 1000 Blocks 80000
Transactions less fees 8.8M FTC
1 % Fee to Transaction volume ratio
Percentage Blocks with Transaction 14%
Average Block Time 4 days 1:33 mins
Block Difficulty
Block Times
Transactions per Block
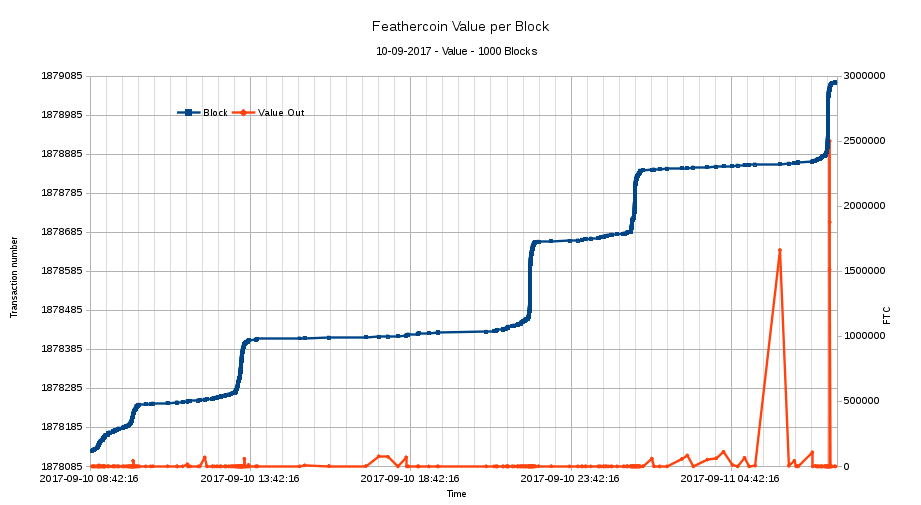
Block Transaction values
